Open-Source Monitoring for a Regional Hospital Network:
Zero License Spend & 71% Fewer Outages
Prometheus and Grafana for full-stack visibility, Alertmanager for intelligent routing, and Uptime Kuma for patient-facing uptime — architected with zero Protected Health Information (PHI) exposure[cite: 13].
 🔍 Expand Executive Service Health Dashboard
⚠️ The Challenge
Following two major health system mergers, the provider was left with over 1,400 Linux/Windows servers, dozens of HL7 integration engines, PACS medical imaging, and lab software spread across 6 hospitals and 40 clinics[cite: 13].
Three overlapping licensed monitoring tools covered barely 57% of the infrastructure[cite: 13]. Over 60% of technical incidents were first reported by clinical nurses rather than automated systems, with detection averaging 38 minutes[cite: 13]. Predictable issues like disk-full integration engines, expired SSL certificates, and database pool saturation repeatedly caused severe clinical downtime, while compliance audits required days of painful manual log aggregation[cite: 13].
⚡ The Cyber Oxygen Approach
We engineered a resilient, HIPAA-compliant open-source observability framework over 14 weeks[cite: 13]:
- Patient-Safety Prioritization (Weeks 1–2): Audited 200+ applications and interviewed 22 stakeholders to rank infrastructure by critical patient-care impact[cite: 13].
- HA Prometheus Infrastructure (Weeks 3–5): Built an on-premise High-Availability Prometheus pair with federated hospital instances (ensuring WAN outages never blind local IT), a 3-node Alertmanager cluster, and Grafana tied into Active Directory SSO with strict RBAC[cite: 13].
- Fleet Exporter Rollout (Weeks 6–10): Deployed node/windows exporters across 1,400+ nodes, blackbox probes for HL7 and DICOM ports, postgres_exporter for connection tracking, and SNMP for physical network infrastructure[cite: 13].
- Synthetic Monitoring via Uptime Kuma (Weeks 6–10): Configured 112 outside-in synthetic monitors checking clinical portals, telehealth, and vendor APIs with keyword checks and active status dashboards[cite: 13].
- HIPAA Guardrails & Shadow Tuning (Weeks 11–14): Ensured zero PHI entered metric labels, enforced mTLS scrape endpoints, and ran alerts silently alongside legacy tools for 2 weeks to eliminate 40% of noisy alerts prior to going live[cite: 13].
Quantified Observability Platform Impact (12-Month Measurement)
| Metric / System Impact | Before Cyber Oxygen | After Cyber Oxygen (12 mo.) |
|---|---|---|
| Unplanned Outage Minutes (Clinical Systems) | 2,140 minutes / year | 620 minutes (−71%)[cite: 13] |
| Mean Time to Detect (MTTD - P1/P2) | 38 minutes | 2.7 minutes (−93%)[cite: 13] |
| Mean Time to Resolve (MTTR - P1/P2) | 3 hours 10 minutes | 1 hour 05 minutes (−66%)[cite: 13] |
| Incidents Reported by Clinical Staff | ~60% of all incidents | 9% (91% auto-detected)[cite: 13] |
| Patient-Portal Uptime | 99.71% | 99.97% (~23 hours/yr regained)[cite: 13] |
| Host Coverage Across Fleet | ~800 hosts (57%) | 1,400+ hosts (100% full visibility)[cite: 13] |
| Actionable Alert Ratio | 18% (high noise/fatigue) | 81% actionable signal[cite: 13] |
| Monitoring Licensing Spend | Six-Figure Annual Cost | $0 License Fee (Open Source Stack)[cite: 13] |
| HIPAA Audit Evidence Preparation Time | 3–4 Days (Manual) | Under 1 Hour (Automated Git Export)[cite: 13] |
Observability Architecture & Real-Time Telemetry Proof
🔍 Expand Grafana Executive Matrix
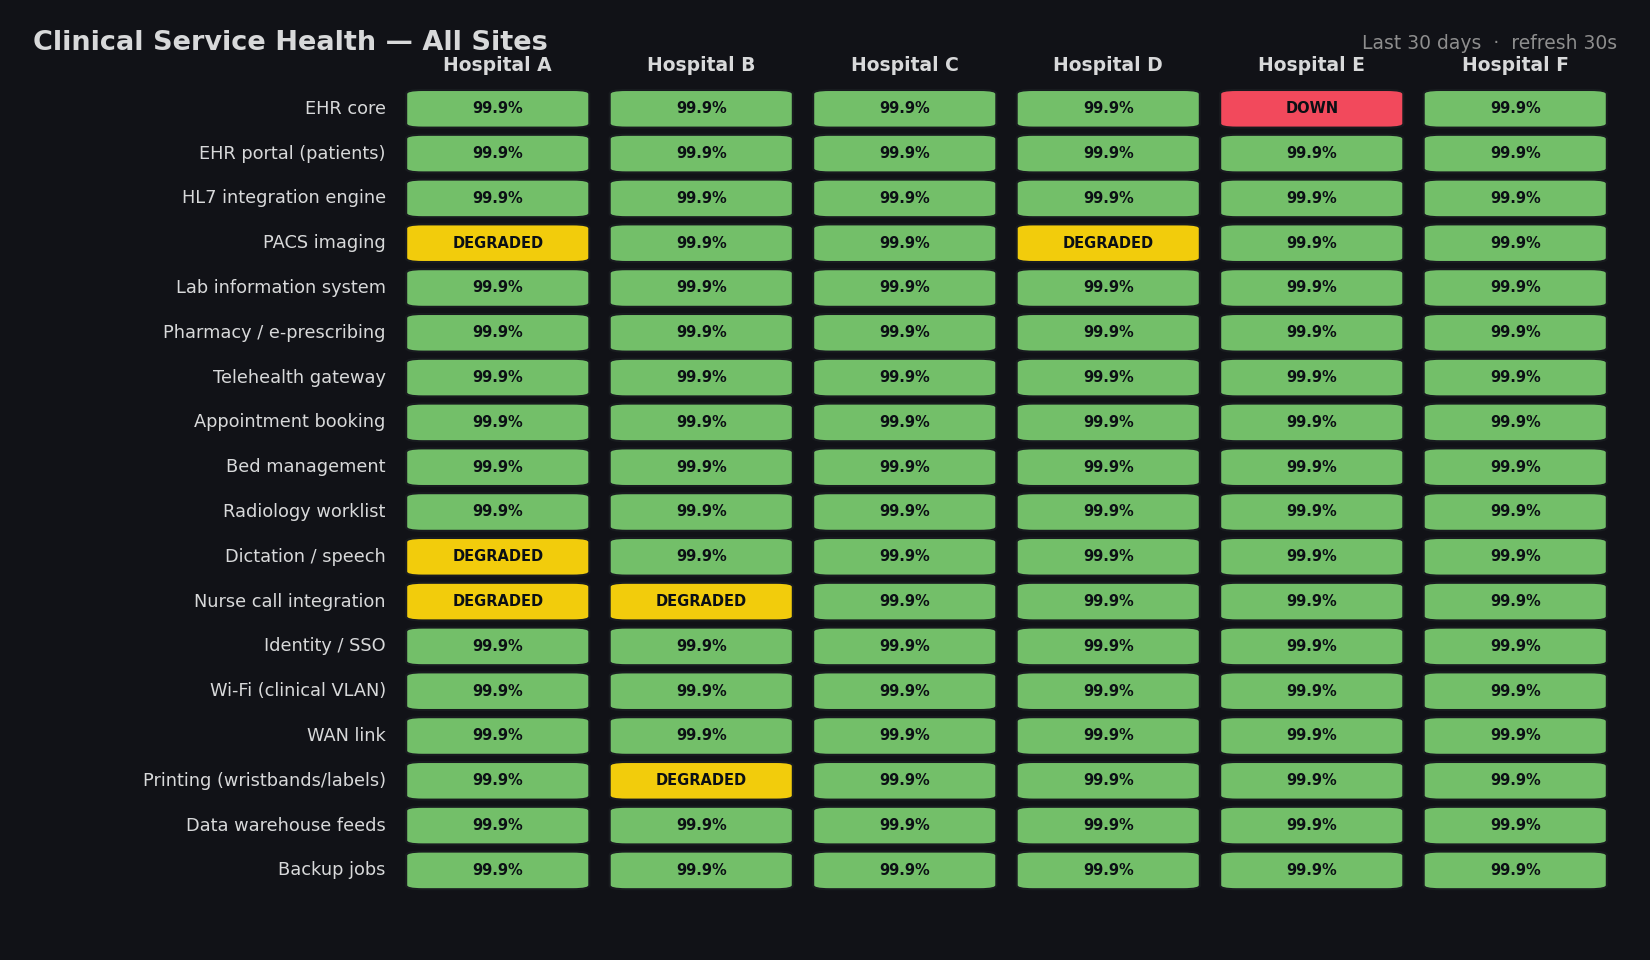
Executive Clinical Service Matrix
Real-time traffic-light matrix tracking 18 core clinical services across 6 regional hospitals, enabling immediate cross-site health visibility for IT leaders[cite: 13].
 🔍 Expand Predictive Analytics Dashboard
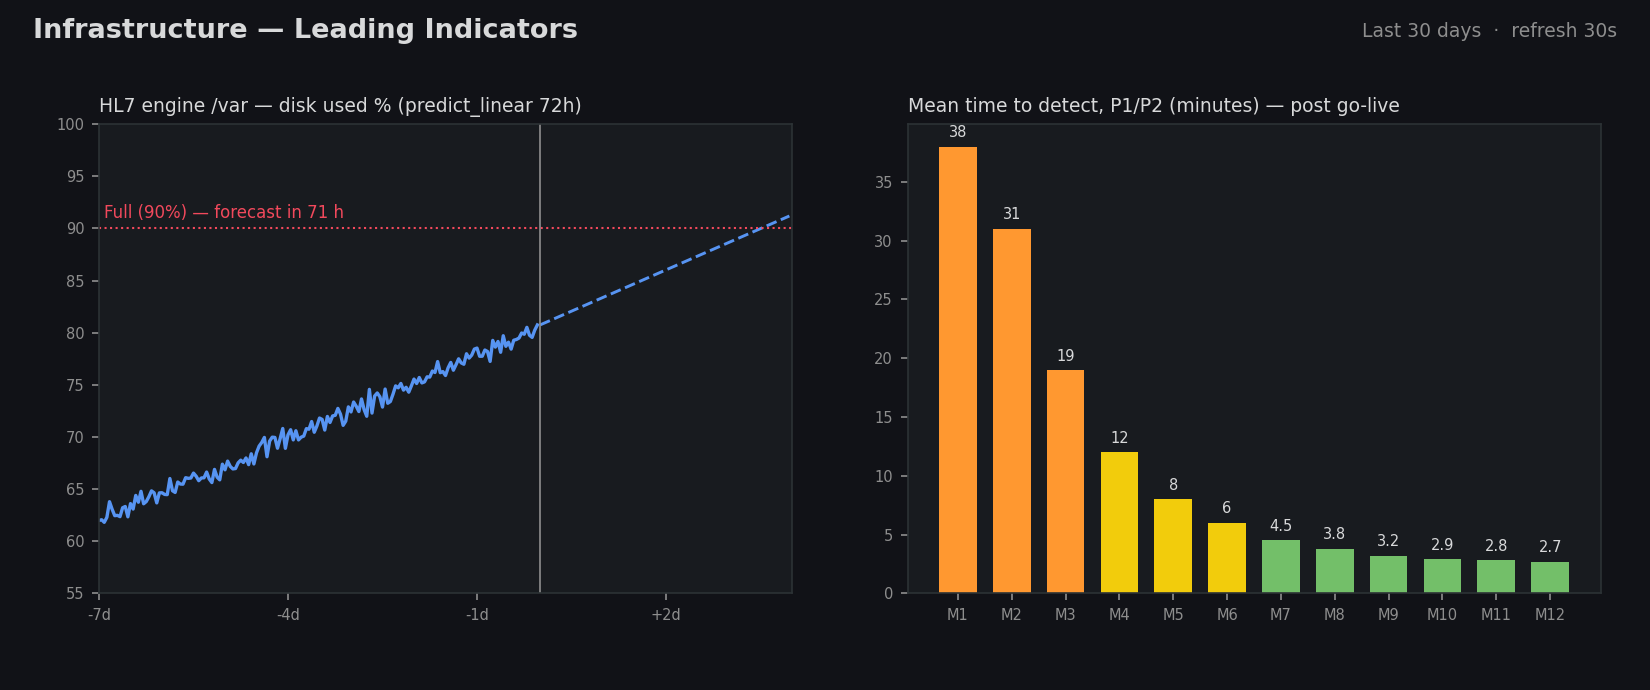
Predictive AI & Leading Indicators
PromQL predict_linear models forecasting HL7 storage exhaustion 72 hours in advance alongside historical MTTD reduction tracking across 12 months[cite: 13].
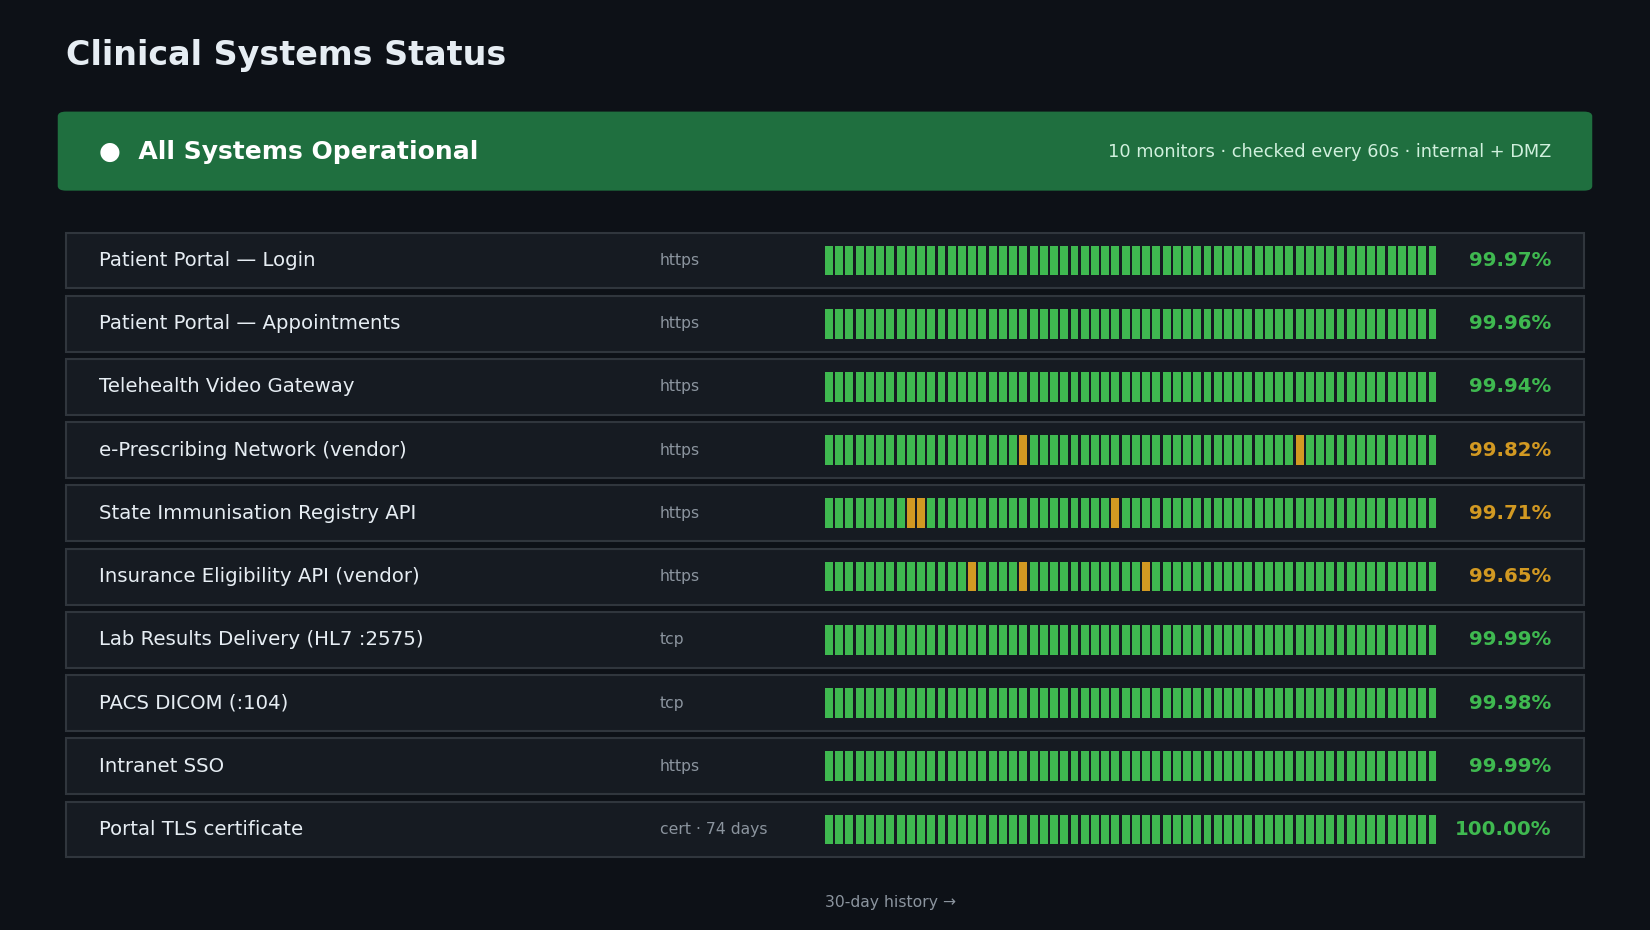 🔍 Expand Uptime Kuma Dashboard
Synthetic Outside-In Monitoring
Uptime Kuma status tracking endpoint availability, e-prescribing APIs, PACS DICOM connectivity, and automated TLS certificate expiration alerts[cite: 13].
“When a nurse manager asks whether the EHR is slow, I pull up one screen and answer in ten seconds — and usually we already know and are already fixing it.”[cite: 13][cite: 13]
Relying on Users to Report Clinical Outages?
Partner with Cyber Oxygen to deploy enterprise-grade open-source observability, eliminate license overhead, and detect incidents before they impact patient care[cite: 13].
Book a 30-Minute Observability Architecture Review[cite: 13]