From 38 Azure VMs to Containers:
Halving Cloud Spend for a Healthcare SaaS Platform
Azure Container Apps for stateless services, Azure Kubernetes Service where fine-grained control mattered, and GKE for GPU-backed AI workloads — migrated in small waves with zero maintenance windows and strict PHI compliance.
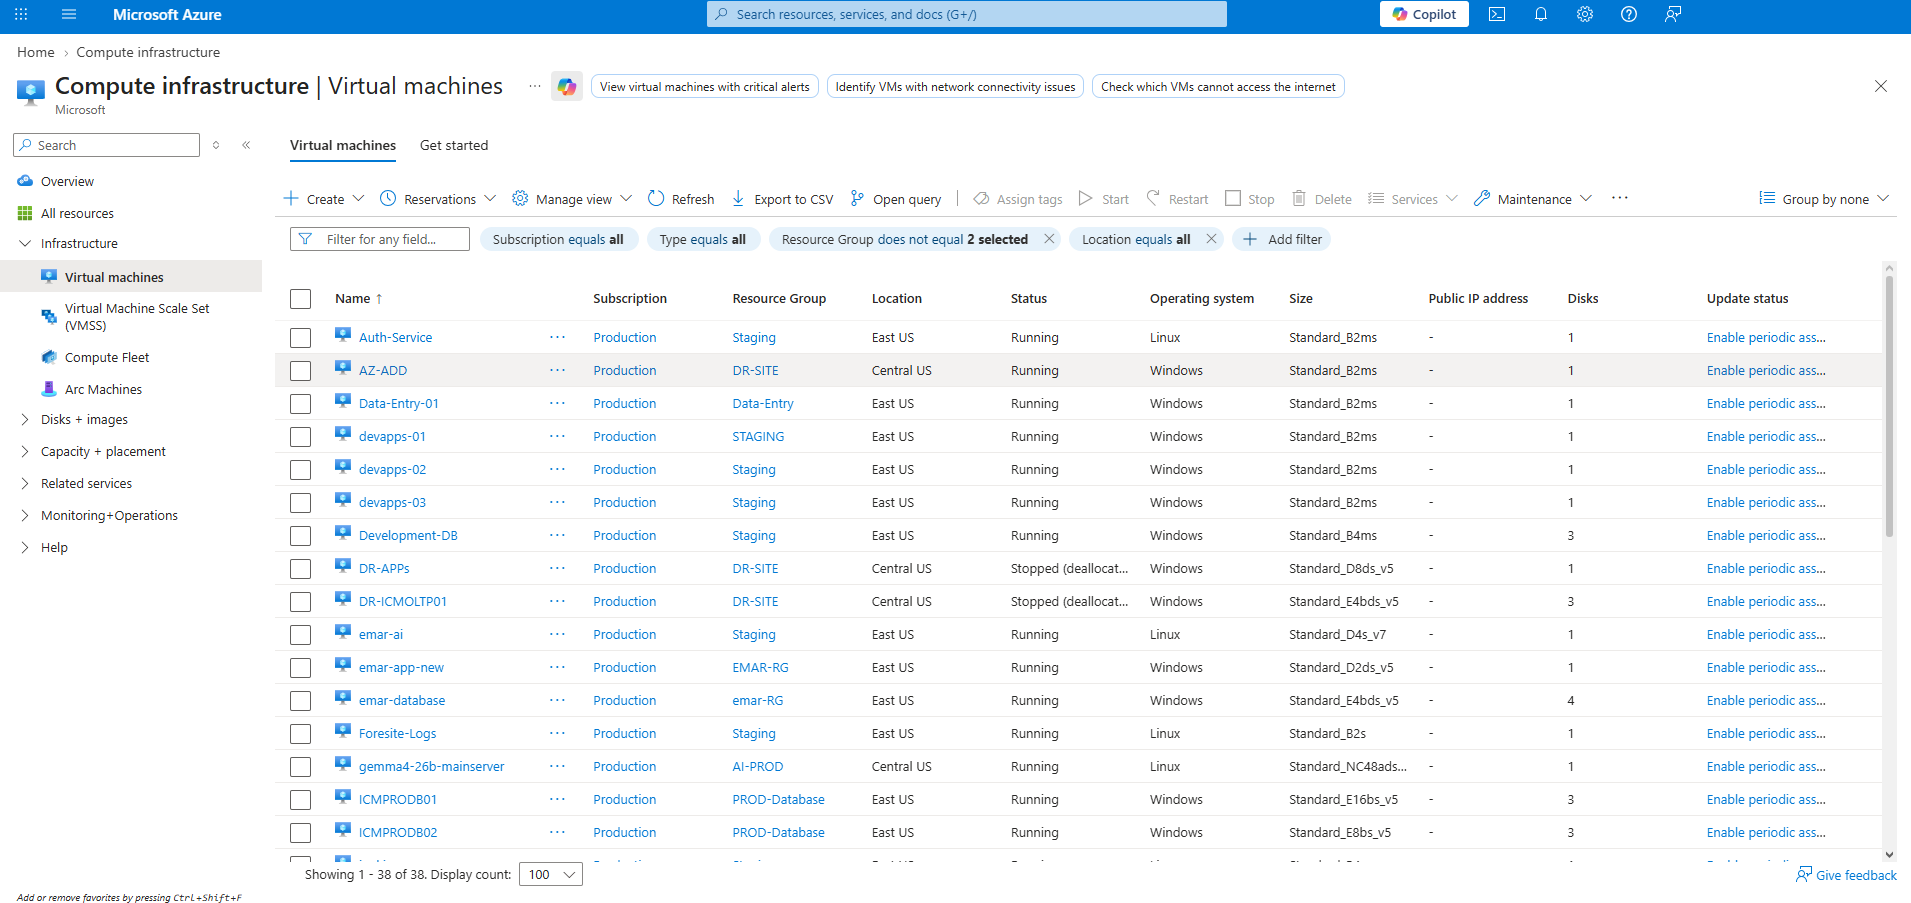 🔍 Expand Initial Azure VM Baseline
⚠️ The Challenge
Five years of rapid growth left the platform running on 38 hand-provisioned Azure VMs across East US and a Central US DR site. Fleet-wide CPU utilization averaged a wasteful 17%.
Releases required manual RDP/SSH sessions and Saturday night downtime windows, restricting production deployments to 3 times per month. A single GPU VM for AI inference ran 24/7 at 20% of total compute cost despite serving traffic only a few hours daily. Recovering from failed VMs took nearly 3 hours, configuration drift caused weekly environment bugs, and annual HIPAA audits required days of manual documentation.
⚡ The Cyber Oxygen Approach
We architected and executed an 18-week, multi-cloud modernization roadmap:
- Inventory & Decommissioning (Weeks 1–3): Catalogued 44 services across 38 VMs. Retired 4 obsolete services and 7 idle VMs, including always-on DR duplicates, prior to migration.
- Multi-Cloud Architecture (Weeks 3–6): Deployed 31 stateless APIs to Azure Container Apps (with scale-to-zero), core identity/audit to AKS, and 4 GPU-backed AI models to GKE for superior cost-efficiency. Everything codified in Terraform.
- Automated CI/CD & GitOps (Weeks 5–8): Implemented GitHub Actions vulnerability scanning and ArgoCD GitOps reconciliation, eliminating manual drift.
- Zero-Downtime Wave Cutover (Weeks 9–15): Migrated workloads in weighted traffic waves (10% → 50% → 100%). Migrated SQL Server and PostgreSQL with under 3 minutes of write-freeze; kept PHI inside Azure compliant boundaries.
- Optimization & Hand-Over (Weeks 16–18): Enabled KEDA autoscaling, configured scale-to-zero GPU pools, and conducted intensive Kubernetes training for client engineers.
Quantified Cloud Modernization Impact (12-Month Measurement)
| Measure | Before Cyber Oxygen | After Cyber Oxygen (12 mo.) |
|---|---|---|
| Monthly Infrastructure Spend | $27,600 | $13,100 (−53%, ≈ $174k/yr saved) |
| Fleet-wide Average CPU Utilization | 17% | 62% |
| Production Deployments / Month | 3 (Saturday windows) | 96 (avg. 4–5 per working day) |
| Lead Time (Merge to Production) | 4 days | 38 minutes |
| Mean Time to Recover (P1/P2) | 2 h 40 min | 9 minutes (−94%) |
| Time to Add Capacity for Traffic Spikes | 55 min (manual) | < 2 minutes (automatic via KEDA) |
| Platform Availability | 99.64% | 99.96% (~28 h/yr regained uptime) |
| Configuration-Drift Incidents | ~1 per week | 0 (enforced via GitOps) |
| HIPAA Evidence Preparation | 4–5 days (manual) | Under 2 hours (Terraform + Git history) |
| AI Assistant GPU Compute Cost | 24/7 Always-on VM | −71% reduction (scales to zero) |
Infrastructure Evolution & Telemetry Proof Elements
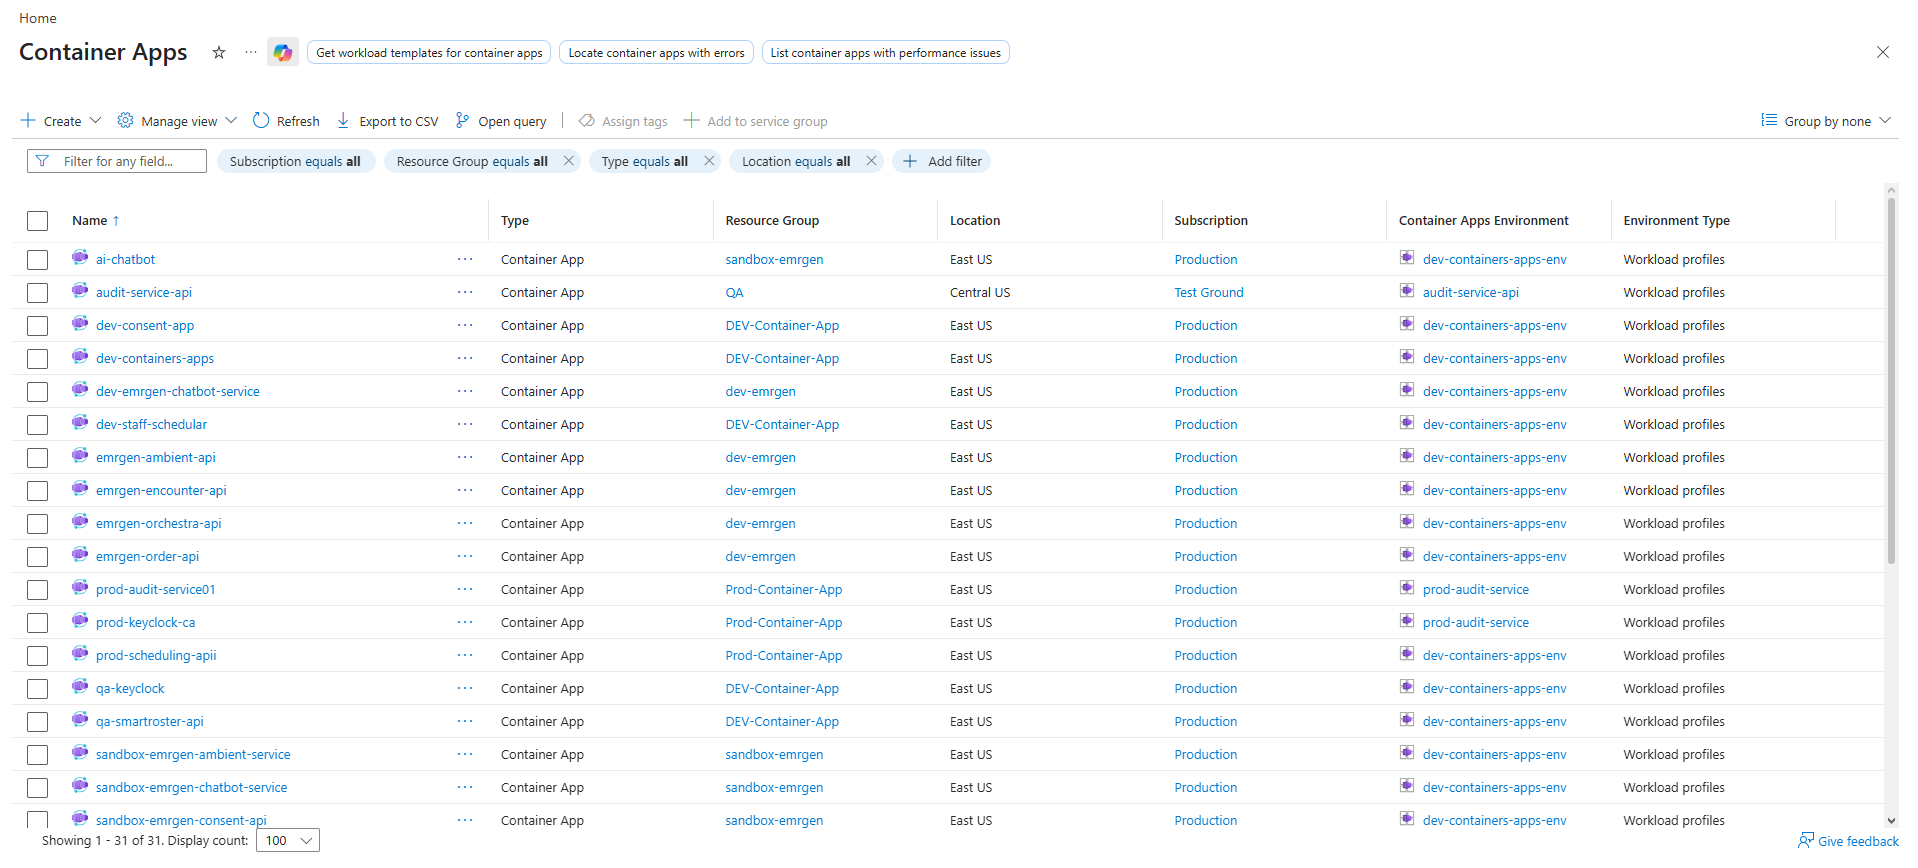 🔍 Expand Azure Container Apps View
Azure Container Apps Modernization
31 stateless services migrated across production, QA, dev, and sandbox environments running on scale-to-zero workload profiles, eliminating idle compute costs.
 🔍 Expand AKS Dashboard
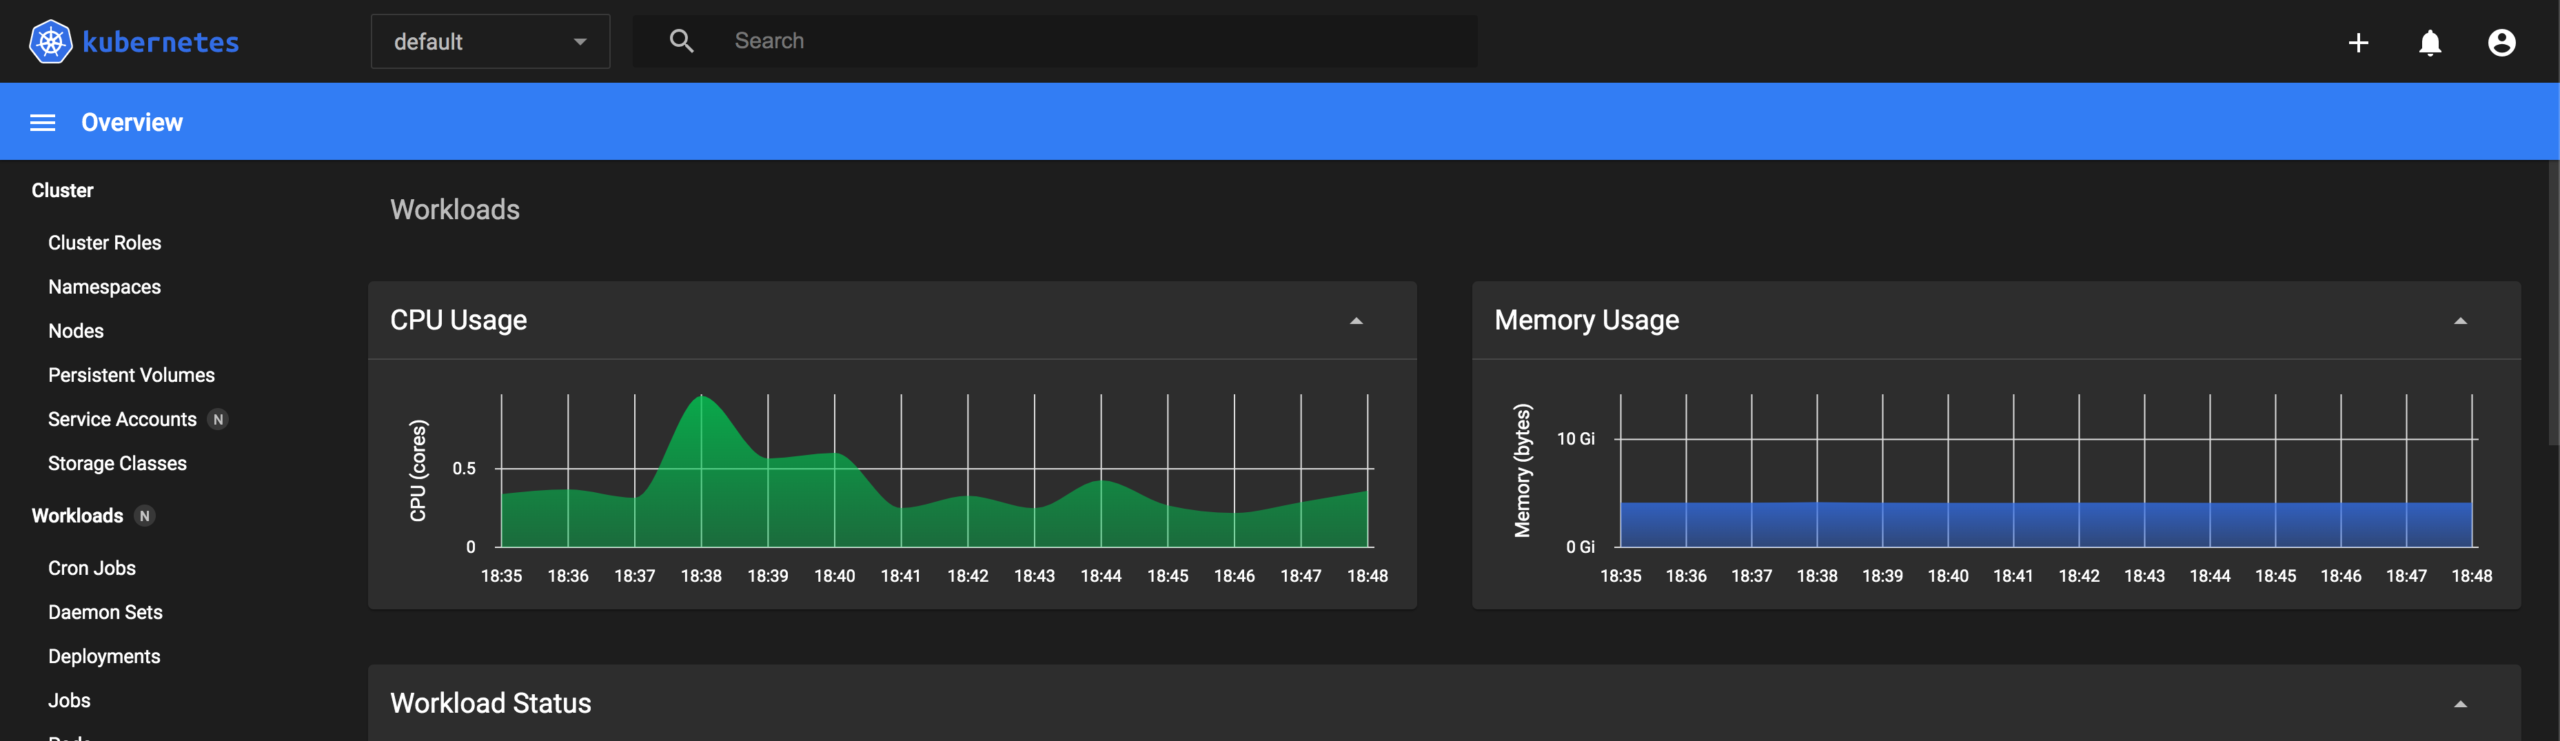
AKS Core Infrastructure Cluster
Kubernetes dashboard monitoring CPU/memory health across stateful services, core authentication, cron jobs, and custom sidecar integrations on Azure Kubernetes Service.
 🔍 Expand GKE Workloads View
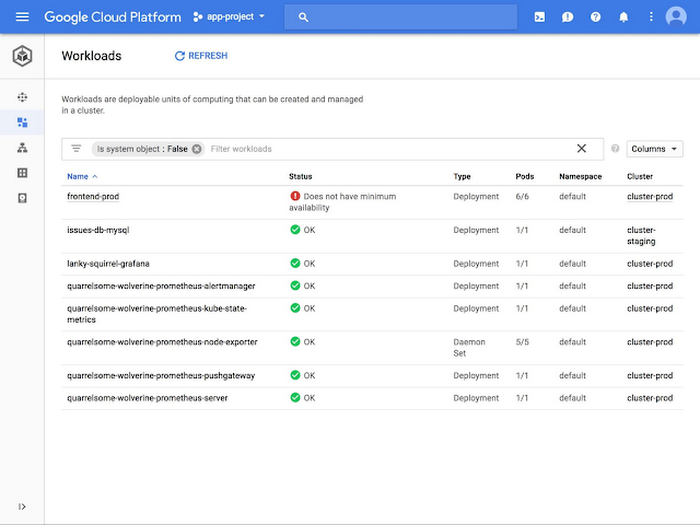
GKE GPU Workloads & Monitoring
Isolated Google Kubernetes Engine cluster hosting GPU-backed AI inference services and telemetry collectors, lowering GPU compute expenses by 71%.
 🔍 Expand Grafana Cost Analytics
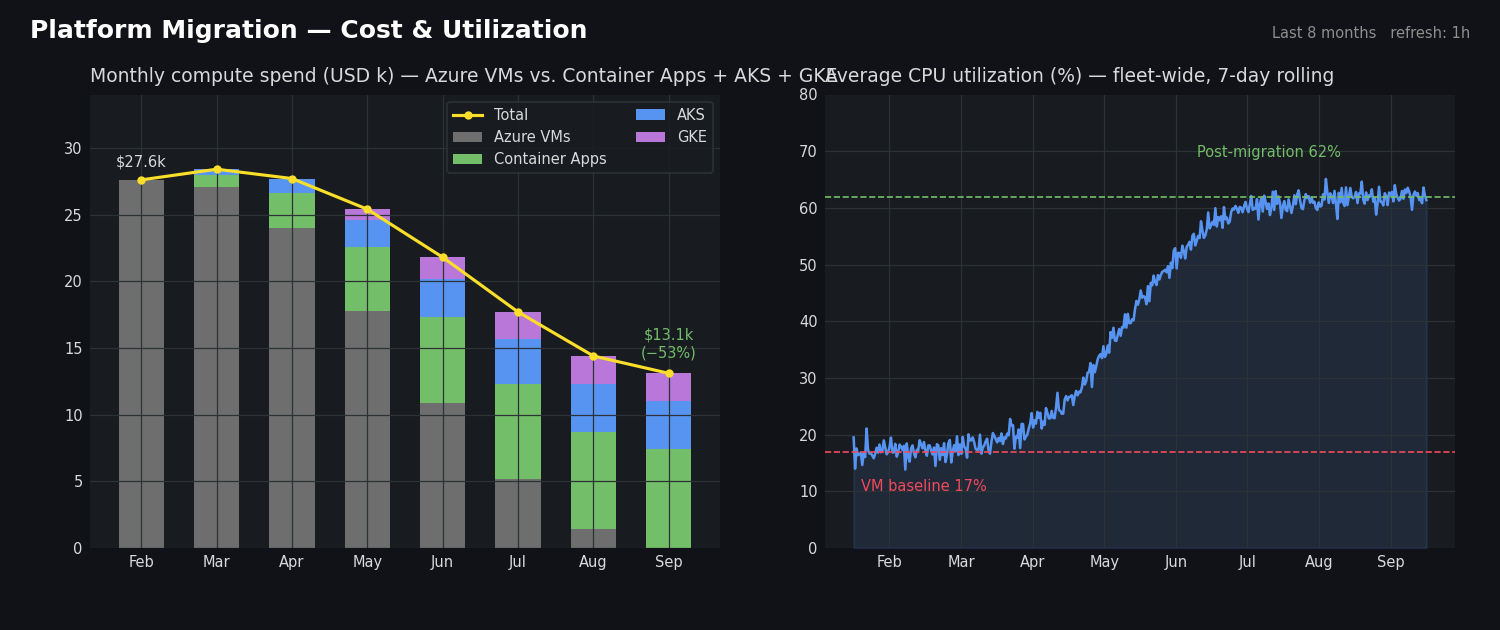
Spend Reduction & CPU Optimization
Real-time Grafana telemetry tracking monthly compute spend dropping from $27.6k to $13.1k over 18 weeks, while fleet-wide CPU utilization rose from 17% to 62%.
“We used to plan releases around who could stay late on a Saturday. Now someone merges a pull request at 2 p.m. and it’s live before their coffee is cold — and our Azure bill is half what it was.”
Paying for Idle VMs and Weekend Deployment Windows?
Partner with Cyber Oxygen to containerize legacy workloads, automate GitOps deployments, and cut cloud infrastructure costs in half.
Book a 30-Minute Cloud Infrastructure Assessment